
This post was originally published on Linkedin on 24 January 2023.
Power system models for the NEM are used by AEMO and the Network Service Providers for their planning and operational studies and have historically been confidential and not made available to the public.
In some circumstances, registered NEM participants can purchase snapshots of the model from AEMO, which essentially capture the full state of the NEM (e.g. generator outputs, loads, node voltages, power flows, etc) at a specific instant in time and is retrieved from AEMO’s OPDMS (Operations and Planning Data Management System) application. These snapshots are typically made available for activities like generator connection studies undertaken by third parties, where a detailed power system model is required to assess technical compliance with the National Electricity Rules.
Maintaining confidentiality of power system models is standard practice around the world (with the exception of New Zealand, who make PSSE and DIgSILENT PowerFactory models freely available for download). For example, the US is explicit about the confidentiality of Critical Energy / Electric Infrastructure Information (CEII), a policy position that was established in the wake of the 9/11 terrorist attacks. Australia is not quite so black and white, and over the years, more and more of what could arguably be considered sensitive electric infrastructure information has made its way into the public domain, to the point now that there is almost enough to build a basic power system model without asking for AEMO’s permission. Indeed, there has already been an attempt to recreate an open NEM model from public data sources.
In this post, I’ll survey the data that is currently available to the public and what additional data is needed to construct a credible model. For the record, I am all for a transparent basic network model (sans commercial-in-confidence data) that is open for all to use, if only to give more people an opportunity to analyse the NEM during a time of transition and help the industry and general public make sense of network issues such as congestion, marginal loss factors, system security, etc.
Geospatial data
AEMO hosts an interactive map of transmission infrastructure and power stations set up as layers over an OpenStreetMap underlay.
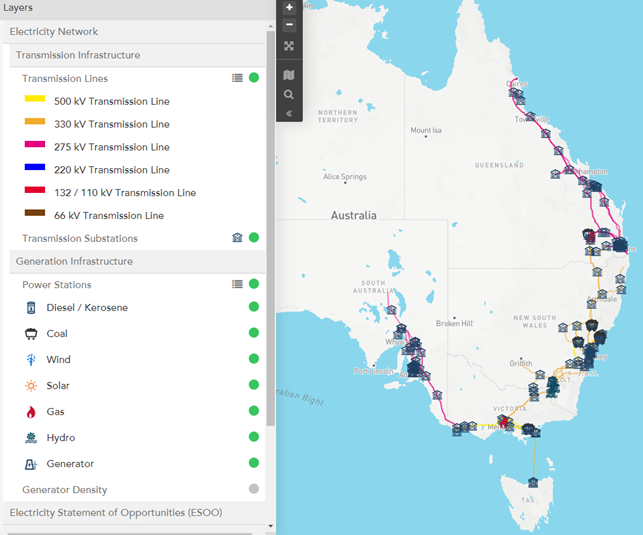
Although the underlying data is not up-to-date and cannot be downloaded, it does provide a good guide to the geospatial structure of the NEM and can be paired with the more regularly updated generation maps that AEMO provide in PDF format.
Actual geospatial datasets (e.g. shapefiles with exact coordinates for transmission lines, substations and power stations) are available from Geosciences Australia:
However, it should be noted that these datasets have not been updated since 2017. As an aside, Western Power provides regular updates of the South West Interconnected System (SWIS) datasets (for example, the substations and transmission line datasets).
Network topology
AEMO used to publish the single line diagrams for the main transmission system in the NEM, but stopped updating them a few years ago and took them down completely in early 2022. However, copies of the 2015 and 2019 versions are still floating around the internet, e.g. from CIGRE Australia (2015 version) and Internet Archive (2019 version).
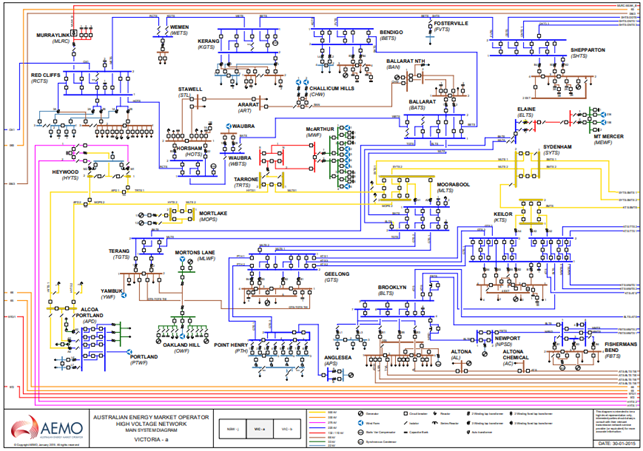
These diagrams provide valuable information on the electrical connectivity of the network, including the location of network elements such as transformers, series and shunt reactive plant and Static Var Compensators (SVCs), as well as the configuration of the circuit breakers and switching devices.
Generator data
AEMO publishes generator information data for existing and new generators such as DUIDs, nameplate capacities, number of units, etc. The NEM Registration and Exemption List also provides information on generators, including ancillary services capabilities.
Operationally, the AEMO MMS database provides 5-min SCADA dispatch values for all generators (by DUID). For even greater granularity, AEMO also publishes 4-sec SCADA data for generator outputs and large load consumption. Note that the 4-sec data was made available for the Causer Pays process for allocating regulation FCAS costs, and is opaque and difficult to use, i.e. the data requires a significant amount of pre-processing to make sense of.
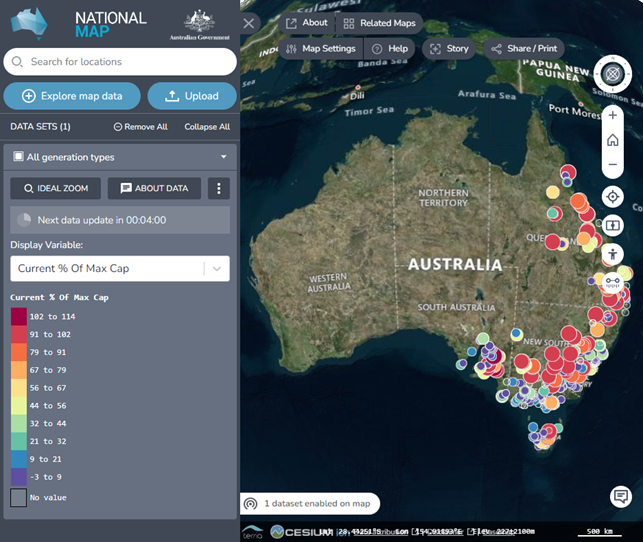
AEMO also provides real-time data for current generation in the NEM in map form:
Demand data
An AEMC rule change from 2014 opened the door for the publication of 15-min or 30-min resolution historical load data at the zone substation level. The rule only requires active power (MW) load data to be provided for the last 10 years, but many DNSPs also publish reactive power (MVAr) data as well.
Zone substation load data from each of the DNSPs can be found from the following links:
- Ausgrid zone substation data
- CitiPower zone substation data
- Endeavour Energy zone substation data
- Energex zone substation data
- Ergon Energy zone substation data
- Essential Energy zone substation data
- Evoenergy zone substation data
- Jemena zone substation data
- Powercor zone substation data
- SA Power Networks zone substation data
- TasNetworks zone substation data
- United Energy zone substation data
Some of the zone substation data has been packaged up into multi-year sets by the CSIRO NEAR program, though typically only up to 2017/18.
Note that for reasons of commercial confidentiality, some substation loads are exempt from the reporting requirements. Large transmission-connected loads are also not part of the reporting framework, but some large load data is published via the 4-sec Causer Pays dataset.
What’s missing?
Besides some out-of-date data (e.g. geospatial data and single line diagrams), the crucial missing piece for constructing a credible power system model is network impedance/admittance data, e.g. resistances, reactances and susceptances of transmission lines, transformers and series and shunt reactive plant, etc. In their 2018 paper, Xenophon and Hill estimate the impedances of the transmission network based on the voltage level and transmission line lengths (calculated from the geospatial data), but the impedances of transformers and reactive plant were neglected.
It may be tempting to think that network modelling information is always treated as confidential information, but there are jurisdictions that release this data to the public. As mentioned earlier, New Zealand makes their network models freely available, but National Grid ESO also publish detailed network modelling data as part of their Electricity Ten Year Statement (ETYS). National Grid ESO provide an up-to-date single line diagram of the Great Britain system (Appendix A), all of the transmission network impedance data (Appendix B), as well as power flows (Appendix C) and fault levels (Appendix D), which would be helpful to tune any self-constructed models. Admittedly, the dataset is not fully complete (e.g. there is no information on transformer tap steps and ranges), but it does allow for a network model to be built without making too many wild assumptions.